Photos
About
Neighborhood
Price history
Similar homes for sale
Recently sold homes
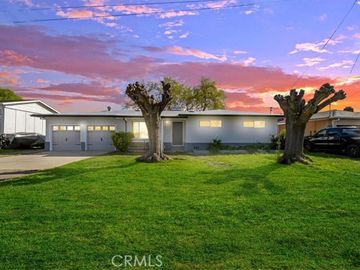
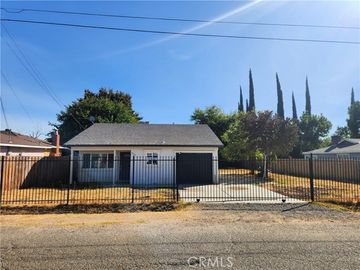
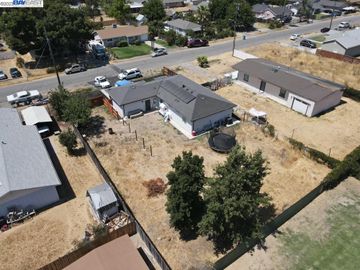
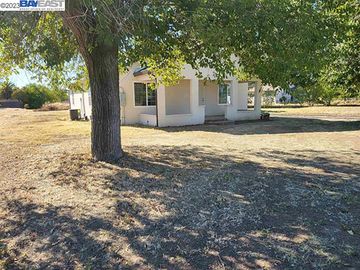
4893 Okmulgee Olivehurst, CA, 95961
$399,998 Home unavailable 4 beds 2 baths 1,300 sqft
None neighborhood info
Essentials nearby
Neighborhood stats
Walkability
Coffee shops
—
no data
Bus stop
—
no data
Supermarket
—
no data
Costco
—
no data
Hospital
—
no data
Park
—
no data
Beach
—
no data
Elementary school
—
no data
Middle school
—
no data
High school
—
no data
Local airport
—
no data
People living in None
52%
Families with children
National average: 39%
27%
Non family households
61,170
Population
$64,912
Average Income
Age & gender
Median age 31 years
More info
Commute types
91% commute by car
More info
Education level
24% have high school education
More info
Number of employees
11% work in education and healthcare
More info
Vehicles available
33% have 3 or more
More info
Vehicles by gender
33% have 3 or more
More info
Housing market insights for
$303.81k
Neighborhood average
sales price*
sales price*
$306.5k
Neighborhood median
sales price*
sales price*
10
Number
of sales*
of sales*
Housing type
69% are single detacheds
More info
Rooms
40% of the houses have 4 or 5 rooms
More info
Bedrooms
68% have 2 or 3 bedrooms
More info
Owners vs Renters
58% are owners
More info
8.17 / 20
Below Average
►
15-20
Most Walkable
10-15
Above Average
5-10
Below Average
1-5
Least Walkable
Walkability according to the National Walkability Index
Price history
Unavailable May 25, 2023
Median sales price 2022
| Bedrooms | Med. price | % of listings |
|---|---|---|
| Not specified | $459.75k | 0.47% |
| 1 bed | $465.18k | 3.55% |
| 2 beds | $610.81k | 21.37% |
| 3 beds | $804.79k | 39.43% |
| 4 beds | $1m | 25.39% |
| 5 beds | $1.31m | 7.25% |
| 6 beds | $1.47m | 1.57% |
| 7 beds | $1.45m | 0.37% |
| 8 beds | $1.43m | 0.36% |
| 9 beds | $1.63m | 0.13% |
| Date | Event | Price | $/sqft | Source |
|---|---|---|---|---|
| May 25, 2023 | Unavailable | $399,998 | 0 | MLS #41023096 |
| May 3, 2023 | Price Decrease | $399,998 | 307.69 | MLS #41023096 |
| Apr 1, 2023 | New Listing | $399,999 | 307.69 | MLS #41023096 |
| Apr 1, 2023 | Unavailable | $399,999 | 0 | MLS #41003652 |
| Jan 3, 2023 | Price Decrease | $399,999 -5.88% | 307.69 | MLS #41003652 |
| Oct 23, 2022 | Price Decrease | $424,999 -7.61% | 326.92 | MLS #41003652 |
| Sep 22, 2022 | Price Decrease | $459,999 -2.13% | 353.85 | MLS #41003652 |
| Jul 29, 2022 | New Listing | $469,999 | 335.71 | MLS #41003652 |
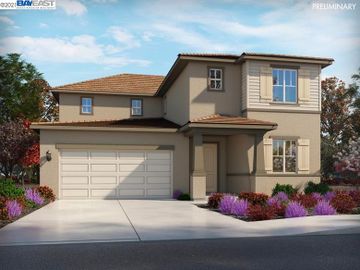
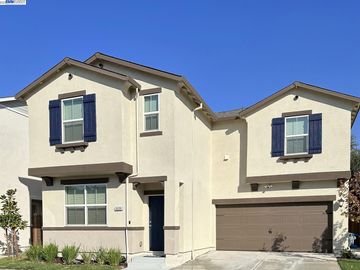
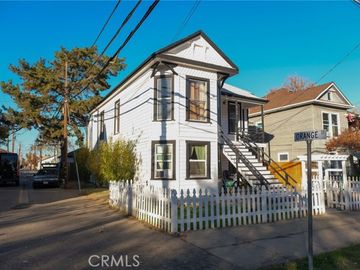
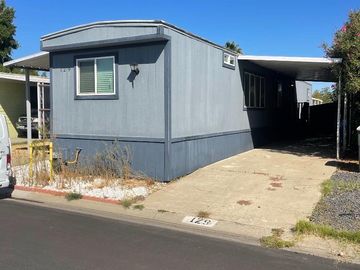
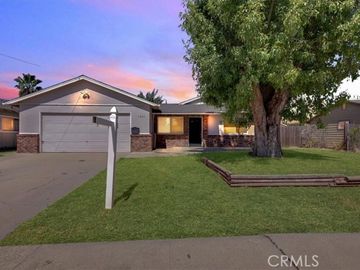
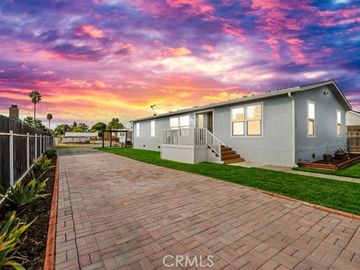
Similar homes for sale
Similar homes nearby 4893 Okmulgee for sale