Photos
About
Taxes
Neighborhood
Price history
Similar land for sale
Recently sold land
Recently sold homes
Similar homes for sale
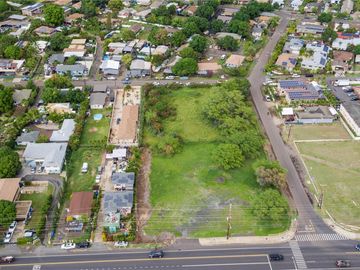
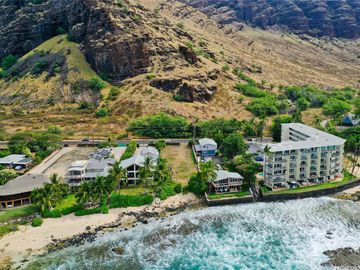
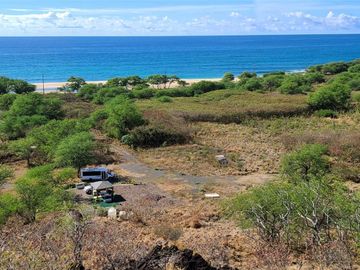
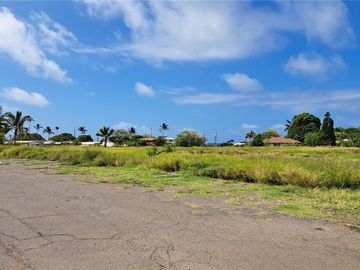
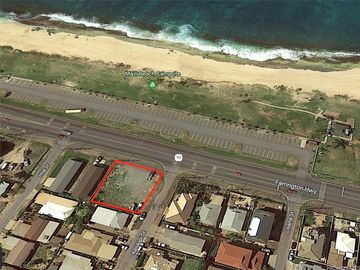
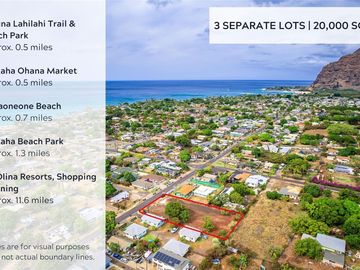
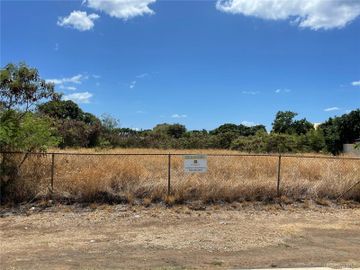
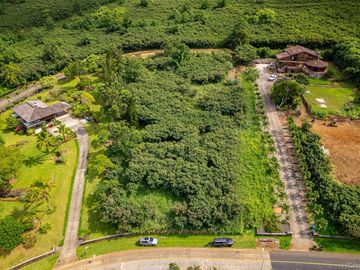
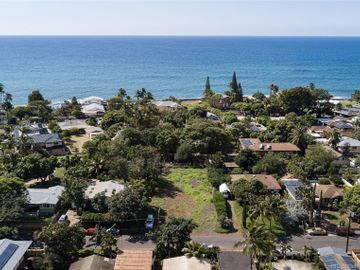
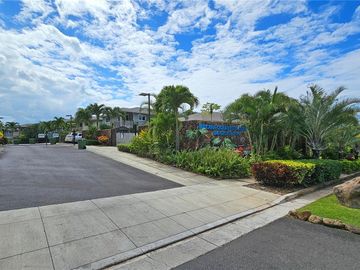
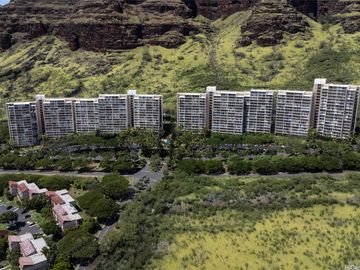
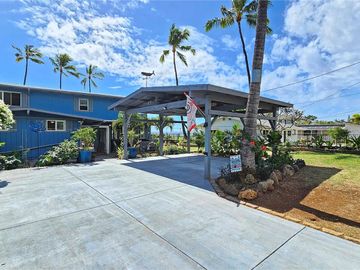
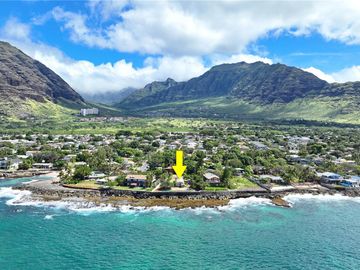
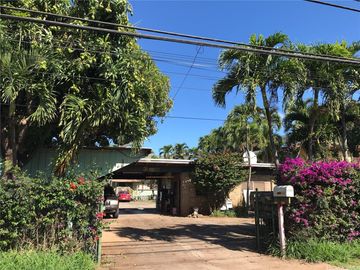
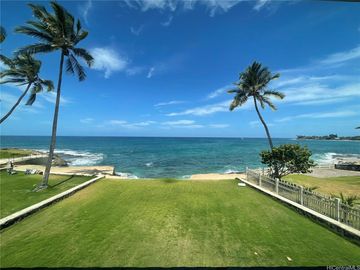
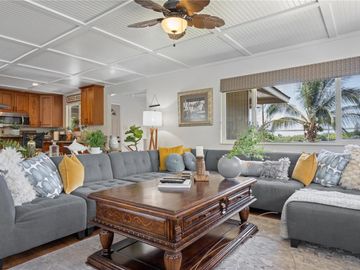
84-939 Farrington Hwy Waianae, HI, 96792
Neighborhood: Makaha$1,900,000 Land withdrawn 0.36 acres
The closest grocery stores are Tamura, 2.39 miles away.
The 96792 zip area has a population of 51,367, and 41% of the families have children. The median age is 33.5 years and 83% commute by car. The most popular housing type is "single detached" and 59% is owner.
Taxes of 84-939 Farrington Hwy, Waianae, HI, 96792
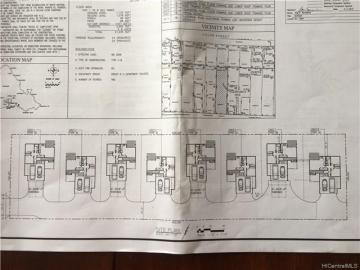
03 - R10 - Residential District zoning / MLS #202201398
Assessed Land value
$807,100
Land Recorded
Land Court
Flood Zone
Zone VE
Topography
Level
Location
Inside
Total Assessed value
$807,100
Tax History
| Year | Taxes | Source |
|---|---|---|
| 2021 | n/a | MLS #202201398 |
| 2019 | $2,174 | MLS #201935796 |
| 2018 | $2,047 | MLS #201811434 |
| 2017 | $1,812 | MLS #201709071 |
| 2015 | $1,800 | MLS #201612530 |
| 2010 | $1,872 | MLS #1111739 |
| 2008 | $3,144 | MLS #2818372 |
About Tax & History Data: We obtain the price and history data from public records and / or from local MLS feeds. Please use the contact form on this page if you would like the most up-to-date information.
Makaha neighborhood info
Essentials nearby
Neighborhood stats
Walkability
Coffee shops
—
no data
Bus stop
—
no data
Supermarket
—
no data
Costco
—
no data
Hospital
—
no data
Park
—
no data
Beach
—
no data
Elementary school
—
no data
Middle school
—
no data
High school
—
no data
Local airport
—
no data
People living in Makaha
41%
Families with children
National average: 39%
26%
Non family households
51,367
Population
$95,412
Average Income
Age & gender
Median age 33 years
More info
Commute types
83% commute by car
More info
Education level
46% have high school education
More info
Number of employees
22% work in education and healthcare
More info
Vehicles available
35% have 2 vehicle
More info
Vehicles by gender
35% have 2 vehicle
More info
Housing market insights for
$551.95k
Neighborhood average
sales price*
sales price*
$515k
Neighborhood median
sales price*
sales price*
102
Number
of sales*
of sales*
Housing type
61% are single detacheds
More info
Rooms
47% of the houses have 4 or 5 rooms
More info
Bedrooms
57% have 2 or 3 bedrooms
More info
Owners vs Renters
59% are owners
More info
11.5 / 20
Above Average
►
15-20
Most Walkable
10-15
Above Average
5-10
Below Average
1-5
Least Walkable
Walkability according to the National Walkability Index
Price history
Withdrawn Feb 22, 2022
Makaha Median sales price 2024
| Bedrooms | Med. price | % of listings |
|---|---|---|
| Not specified | $425k | 0.43% |
| 1 bed | $450.02k | 3.58% |
| 2 beds | $578.29k | 21.44% |
| 3 beds | $760.87k | 39.21% |
| 4 beds | $947.6k | 25.51% |
| 5 beds | $1.21m | 7.17% |
| 6 beds | $1.47m | 1.66% |
| 7 beds | $1.4m | 0.41% |
| 8 beds | $1.4m | 0.39% |
| 9 beds | $1.7m | 0.09% |
| Date | Event | Price | $/sqft | Source |
|---|---|---|---|---|
| Feb 22, 2022 | Withdrawn | n/a | 0 | MLS #202201398 |
| Feb 22, 2022 | New Listing | n/a | 0 | MLS #202201398 |
| Jan 22, 2022 | Coming Soon | n/a | 0 | MLS #202201398 |
| Mar 2, 2021 | Expired | $1,288,000 | 82.53 | MLS #201935796 |
| Dec 29, 2019 | New Listing | $1,288,000 +21.51% | 82.53 | MLS #201935796 |
| Jun 4, 2018 | Sold | $1,060,000 | 67.92 | Public Record |
| Jun 4, 2018 | Price Decrease | $1,060,000 -17.7% | 67.92 | MLS #201811434 |
| May 7, 2018 | Under contract | $1,288,000 | 82.53 | MLS #201811434 |
| Apr 27, 2018 | New Listing | $1,288,000 -19.5% | 82.53 | MLS #201811434 |
| Feb 25, 2018 | Withdrawn | $1,600,000 | 100.59 | MLS #201709071 |
| Jun 14, 2017 | Price Increase | $1,600,000 +6.67% | 100.59 | MLS #201709071 |
| May 3, 2017 | New Listing | $1,500,000 +100% | 94.3 | MLS #201709071 |
| Aug 29, 2016 | Sold | $750,000 | 48.06 | Public Record |
| Jun 3, 2016 | Under contract | $800,000 | 51.26 | MLS #201612530 |
| May 24, 2016 | New Listing | $800,000 +14.29% | 51.26 | MLS #201612530 |
| Dec 31, 2011 | Expired | $700,000 | 44.85 | MLS #1111739 |
| Sep 26, 2011 | New Listing | $700,000 -30% | 44.85 | MLS #1111739 |
| May 20, 2009 | Expired | $1,000,000 | 64.08 | MLS #2818372 |
| Nov 20, 2008 | New Listing | $1,000,000 -37.5% | 64.08 | MLS #2818372 |
| Oct 26, 2005 | Expired | $1,600,000 | 0 | MLS #2512398 |
| Aug 17, 2005 | Pending | $1,600,000 | 0 | MLS #2512398 |
| Aug 3, 2005 | New Listing | $1,600,000 | 0 | MLS #2512398 |
Similar land for sale
Similar homes nearby 84-939 Farrington Hwy for sale